
Here, at 4soft, it is not always about business. When our team members are not actively engaged in work for our clients, we like to find fun and ambitious ways to challenge ourselves and gain new knowledge.
And so, in late May, a few of us decided to take up a Data Science project. At Kaggle, we found datasets from NFL Big Data Competition 2022 – a competition where Data Science tools are used for gaining new insights into American football. Before taking it any further, we needed to understand the available data.
American football is an exotic sport in Poland. So first, we devoted a considerable amount of time to figure out the game. Once we grasped some basics, we were ready to dive deeper into the data at hand.
The datasets covered three regular NFL seasons from 2018 to 2020. We got tracking data, where each row was a record of player or ball position, speed, and acceleration. This information was recorded every 100 milliseconds for the entire duration of a play.
We also had players’ data, with short characteristics of all players involved in any of the three seasons. Next, there was game data – a record of teams involved in each game and the time of it. Finally, we also had play data split into two datasets. Both summarized different aspects of the recorded plays.
At some point, we clarified what we wanted to achieve with the project.
Our application needed to perform the following tasks:

We used numerous technologies when developing the application. Here’s a list of the most important of them with short descriptions.
Virtually all the code in our application is written in Python, which is a go-to programming language in Data Science and Machine Learning fields. Most other libraries or frameworks we use are either written in Python or have an API in Python. The main exception is JavaScript which we use to build the server-side of the application.
The pandas is a popular and well-established library for data analysis in Python and serves as a dependency of many useful packages. Initially, we planned to use it for data processing, but in the meantime, we learned about Polars – a new library for data processing written in Rust and an API in Python.
It turned out that Polars eats pandas, at least in terms of how fast some operations on data are. However fast, it is a new technology and isn’t compatible with many important libraries. We use it wherever possible, reverting to pandas when Polars objects aren’t supported.
Another technology we adopted for data processing was Apache Spark. We use the Spark Structured Streaming library, which provides fast, scalable, and fault-tolerant stream processing. The operations performed on the data are defined in the same way as in Spark SQL. After defining the input and output, and starting a query, Spark automatically detects and processes all the new data.
To keep track of the most recent updates to datasets, we use DVC – Data Version Control. The name is self-explanatory: DVC is an open-source version control system for Data Science and Machine Learning projects. It versions big files with data or models by caching their snapshots and storing their metadata (including links to them) in Git repositories. Reverting to previous versions of data may be as simple as reverting to a commit with the required data version.
We built the Graphical User Interface with Streamlit. It’s a framework for building fast web apps in Python. Well suited for data visualization, Streamlit is another technology in every Data Scientist’s basic toolbox.
To create the visualization of the pitch, we used the Pillow, an image processing library. The graphs were created using Plotly.
We used scikit-learn, XGBoost, and Keras to implement and train the models. Scikit-learn is probably the best-known Python library for Machine Learning, which includes many tools and models. XGBoost implements machine learning algorithms within Gradient Boosting. Keras is a high-level interface to TensorFlow, which is a Deep Learning platform. We used MLflow to track model parameters and their scores.
We developed the application in three repositories, each corresponding to a separate component:
The scheme below shows relationships between components. The smaller windows within components represent main functionalities, each of which is accompanied by the most important technologies it utilizes.
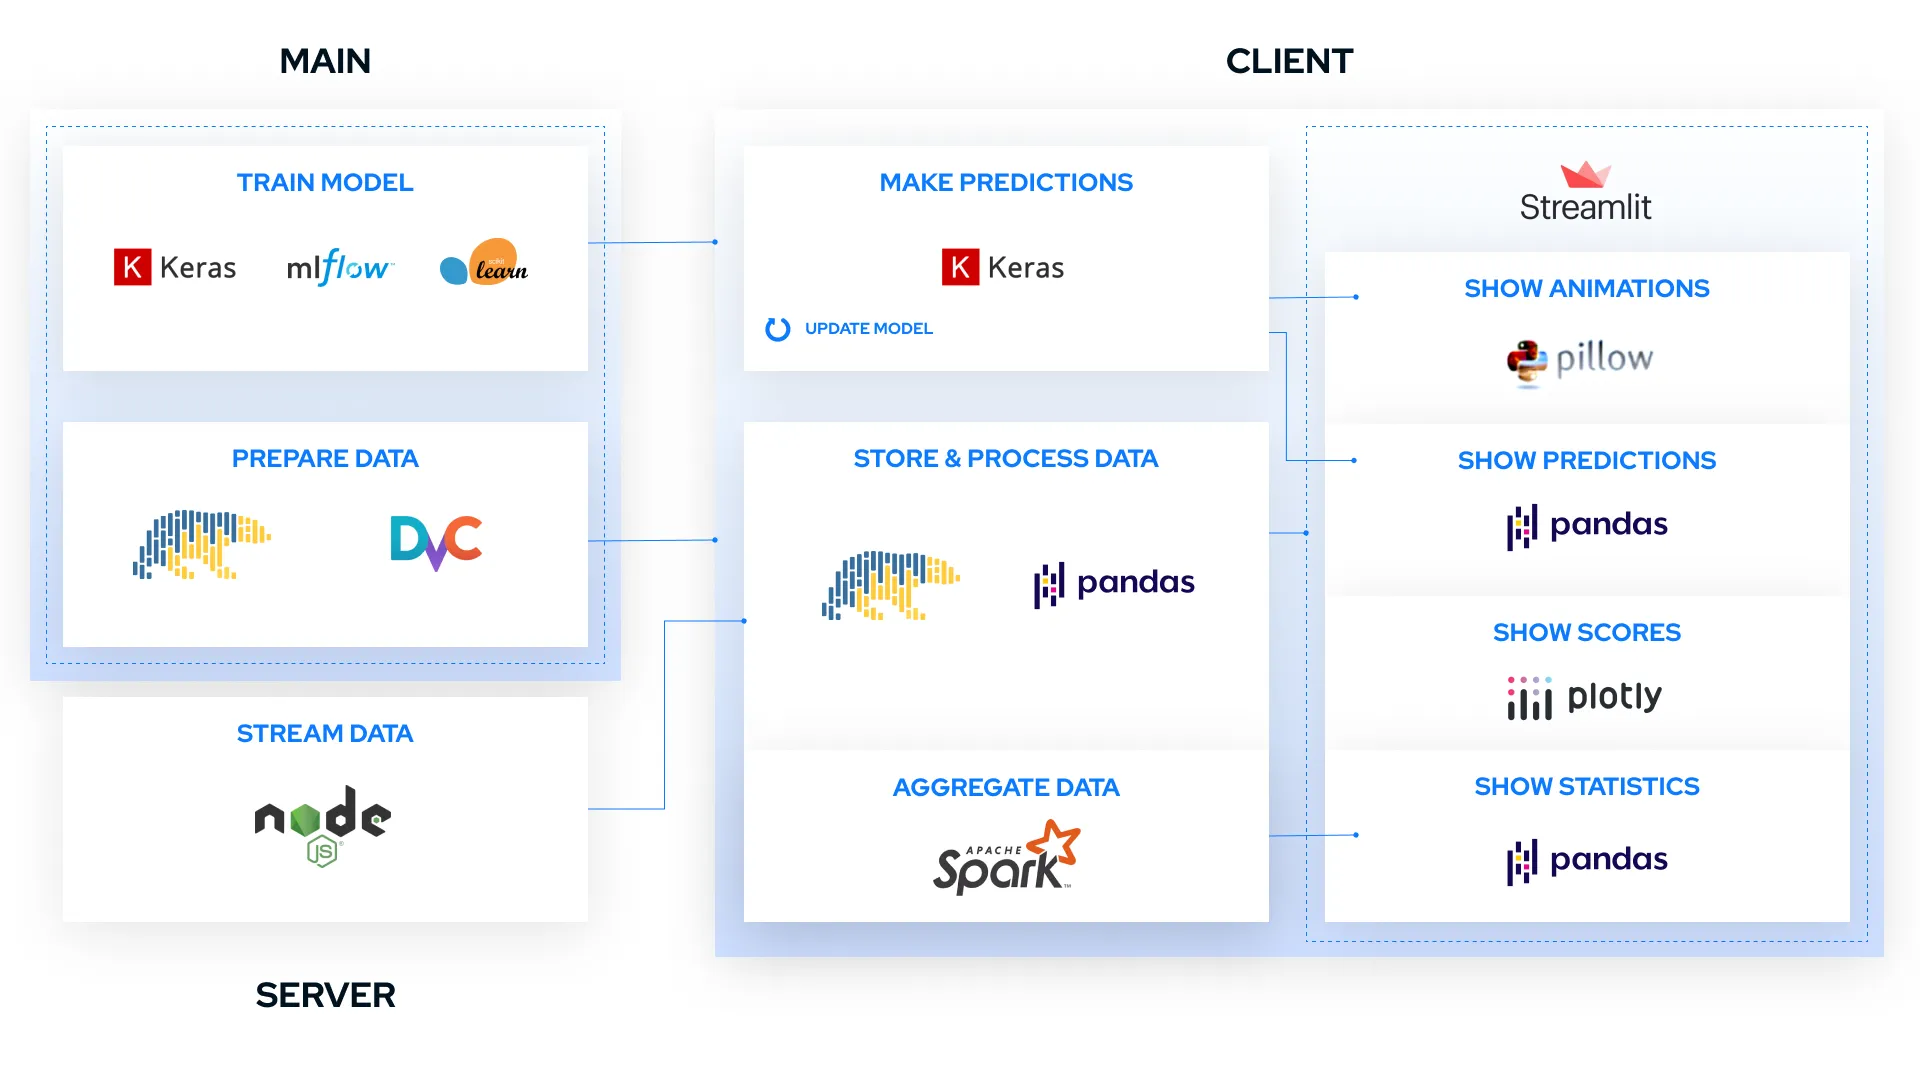
The main component has two primary functionalities.
The provided data tables were, in general, of high quality. However, some functionalities require data to be in a specific form. For instance, a file with tracking data must be sorted chronologically so that when read row by row, it can simulate the streaming of live games.
Another example is that we found out that our data’s final scores were absent. Thus, we needed to find them in another data set and then join it with our data. These preparatory operations on data were performed in the main repository using Polars. The whole data processing was organized into a pipeline using DVC. DVC was also a means of data transportation between main and other repositories.
The model tries to predict the winner based on which teams are playing, the difference in their average scores from the last two, four, and sixteen games, the difference in their Elo ranking, and the difference in the Elo ranking of the quarterbacks.
We tested such models as Support Vector Machine, Random Forest, K-Nearest Neighbor, Logistic Regression, Gradient-boosted Decision Trees, Multi-layer Perceptron, and Fully Connected Neural Network.
We used cross-validation to find the best models and their hyperparameters. The best results were achieved by the neural network, support vector machine, and linear regression. We decided to choose a neural network. Our model has 3 hidden layers with 256 neurons each, dropout, and the activation function. The output is one neuron with a sigmoid activation function and means the probability of victory for the home team. The model achieved the accuracy = 0.655 and brier score = 0.217.
The server is used to simulate a real stream of data collected during NFL games. It is written in JavaScript and runs in Node.js. It uses the Socket.io library for communication.
The server sends tracking data and information about the end of actions and matches. Action summaries and match results are stored in memory, and tracking data is read from the file line by line. The timestamp, playid, and gameid are extracted from each line. The server uses the timestamps to calculate the amount of time that must elapse before it sends the next lines of tracking data.
Action summaries are sent when the server detects a discontinuity in the tracking data, and match results are sent when at least 4.5 hours have passed (according to the time from the tracking data) since the first recorded action in a match.
The client component may be roughly divided into background processes involving processing streamed data and making predictions from the model and graphical user interface.
The predictive model, fitted in the main repository, was moved to the client via DVC. There, it was used to predict the results of oncoming games. Furthermore, the results of streamed games were added to historical data, and the model was updated after every week of games.
The data received from the server is preprocessed into a dictionary. The tracking data is divided into matches to display the visualization and stored in the corresponding objects. In addition, data from all matches are added to the list. This data is later saved to a file, and the list is emptied.
Tracking data and action summaries are saved to disk. Spark processes these automatically. The Elo ranking is also updated based on the streamed data. After all matches from a given week are completed, the model is trained on the data containing the results of those matches.
Written in Streamlit, it consists of pages corresponding to four functionalities.
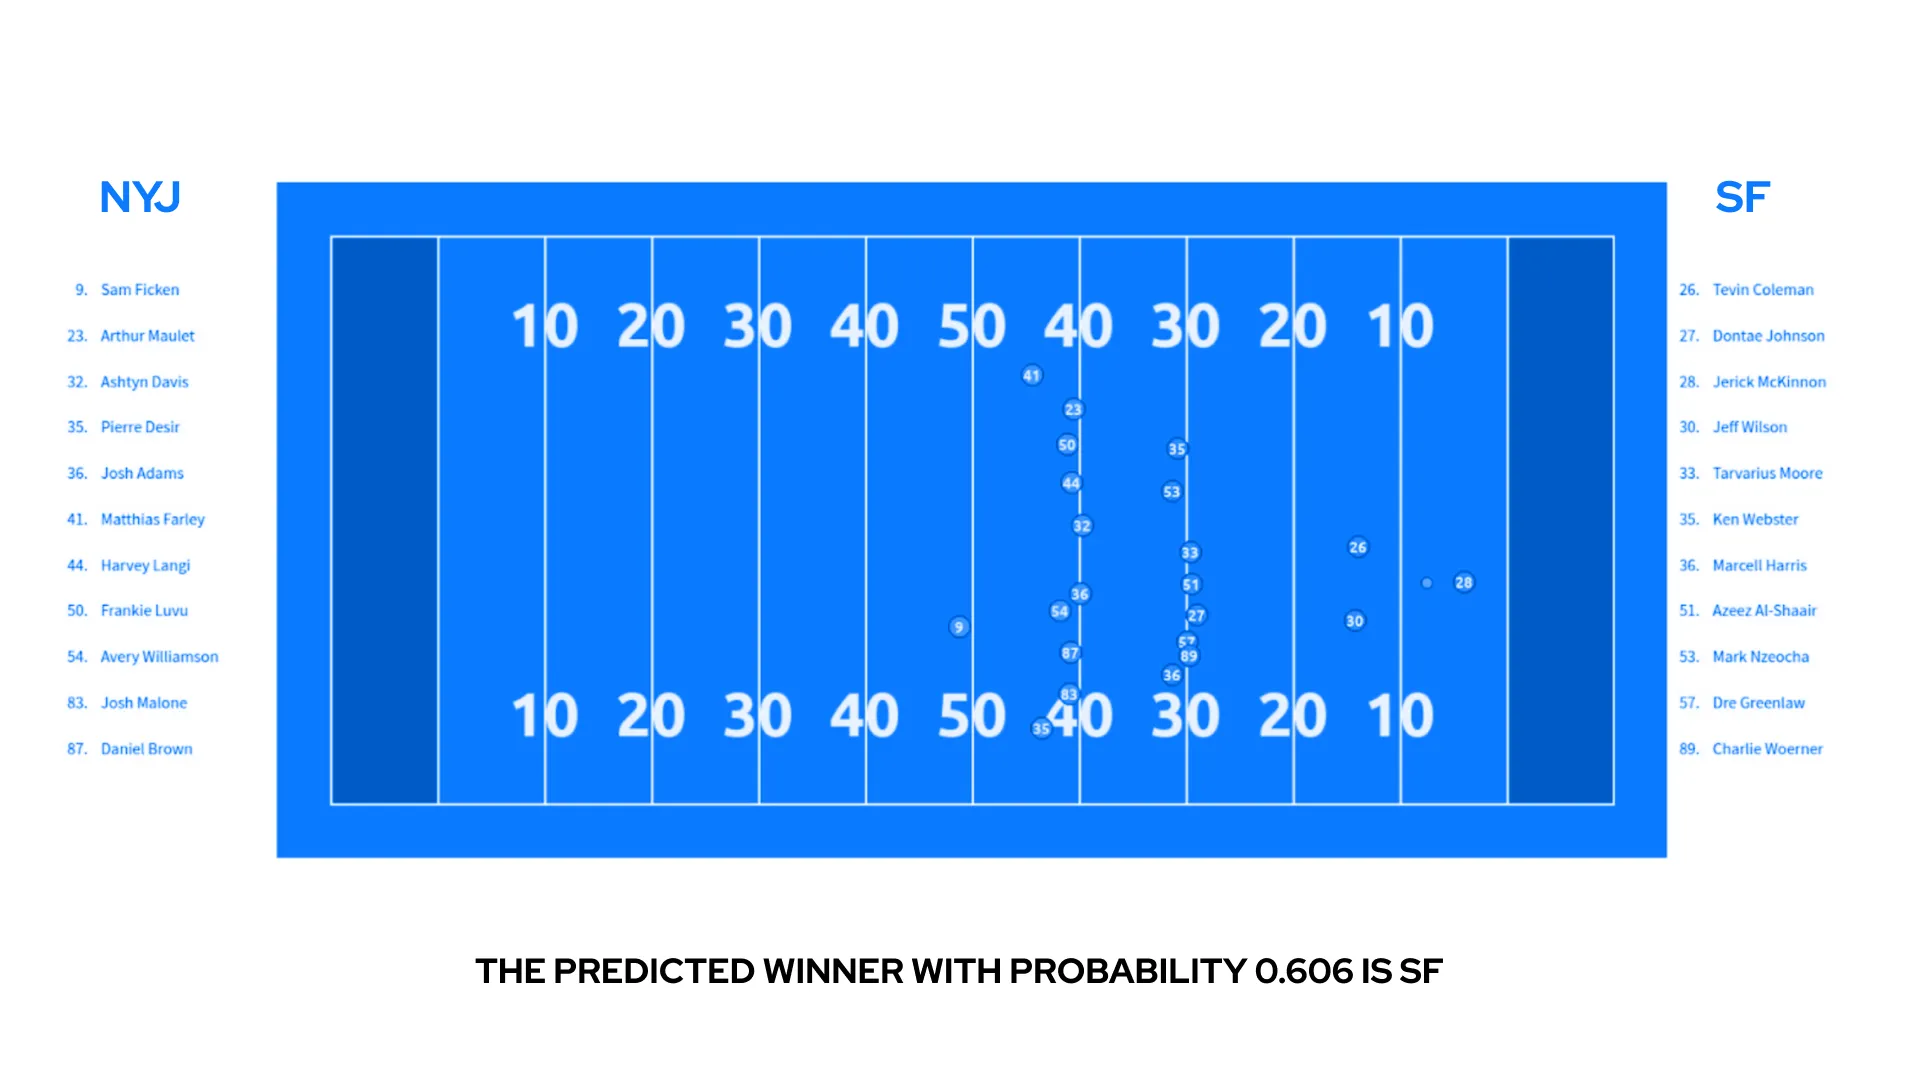
Streamed coordinates of players and the ball were drawn on the picture of the football field and displayed. Thanks to a fairly high frequency of tracking information (10 frames per second), this gives a moderately fluent animation. In addition to showing a “live” game, the page displays the names of all players involved in a given play as well as predictions for the entire game.
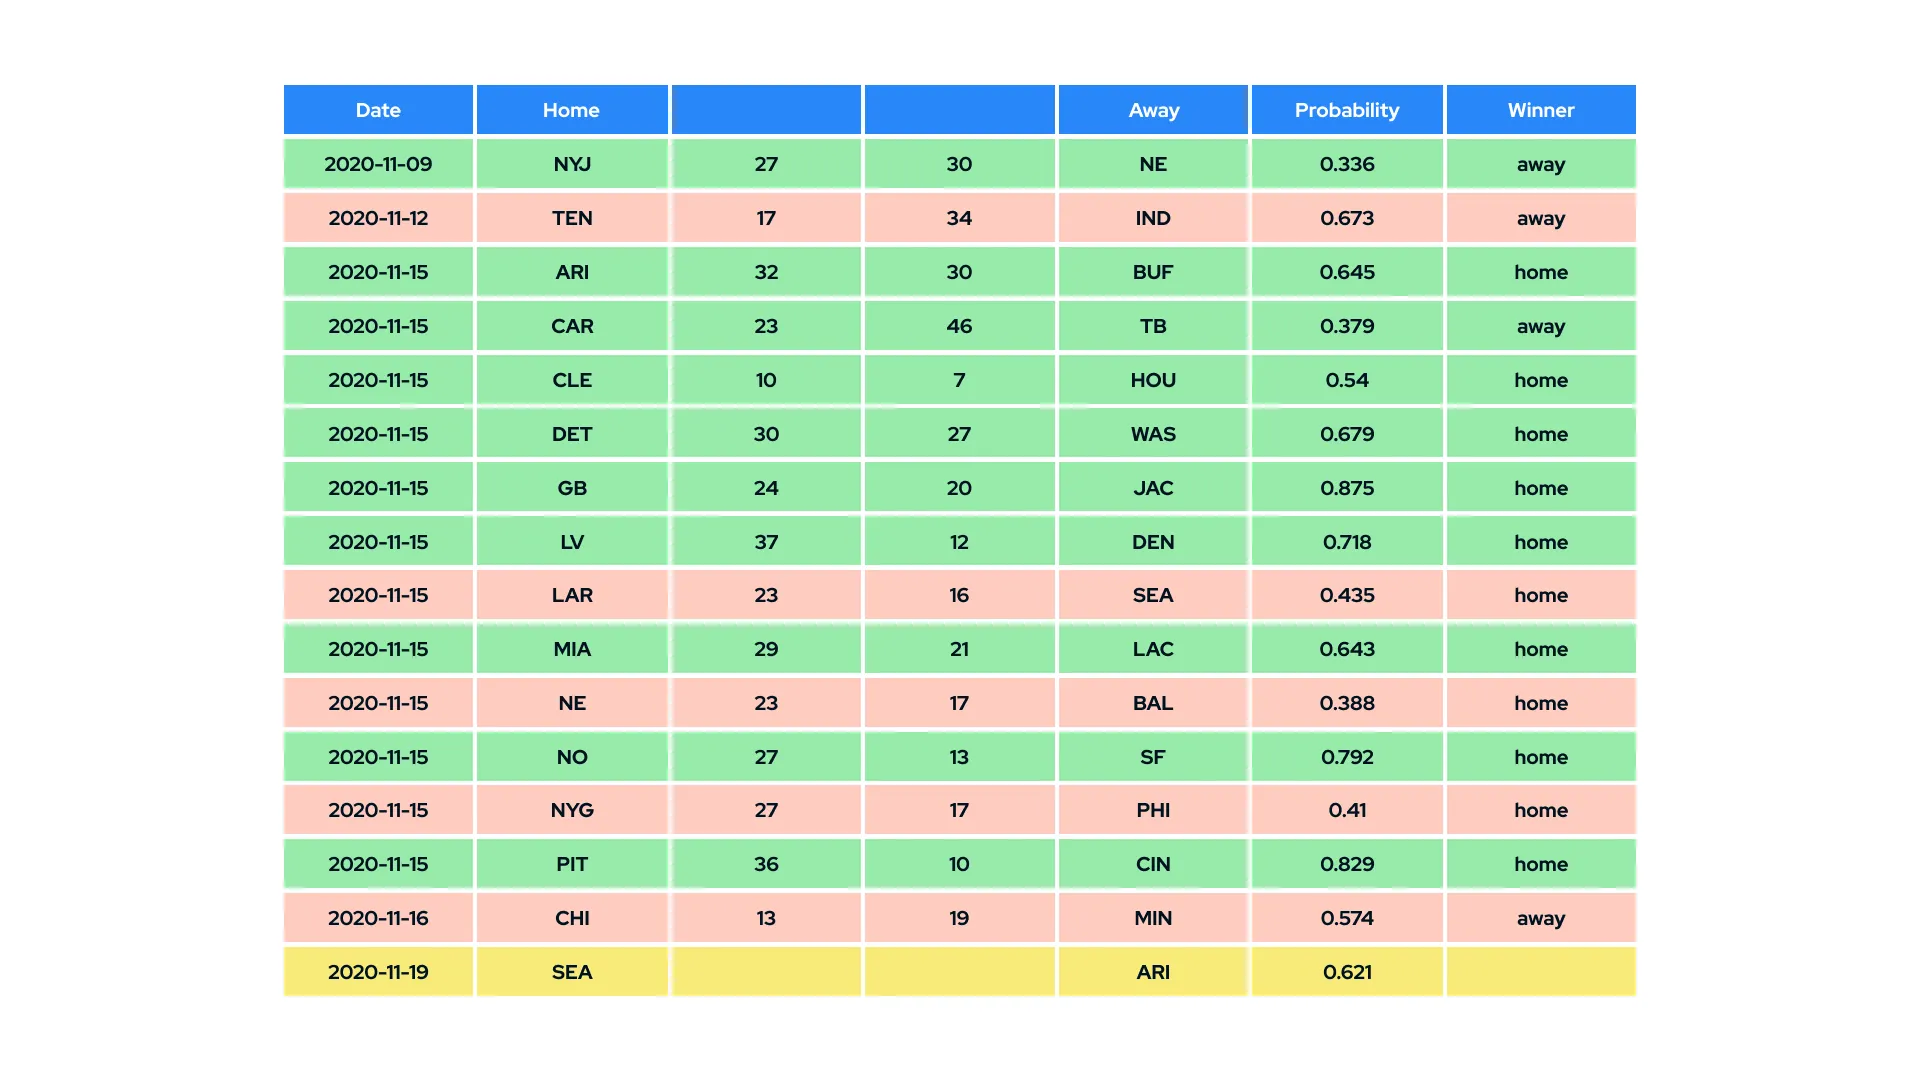
All the predictions of the model were saved. Another page displays these predictions, together with results of finished games, giving a possibility to evaluate the accuracy of predictions.
The information on all started games was gathered on the table. Each row was colored – yellow when the game had not finished, green when the prediction was accurate, and orange when the prediction was wrong.
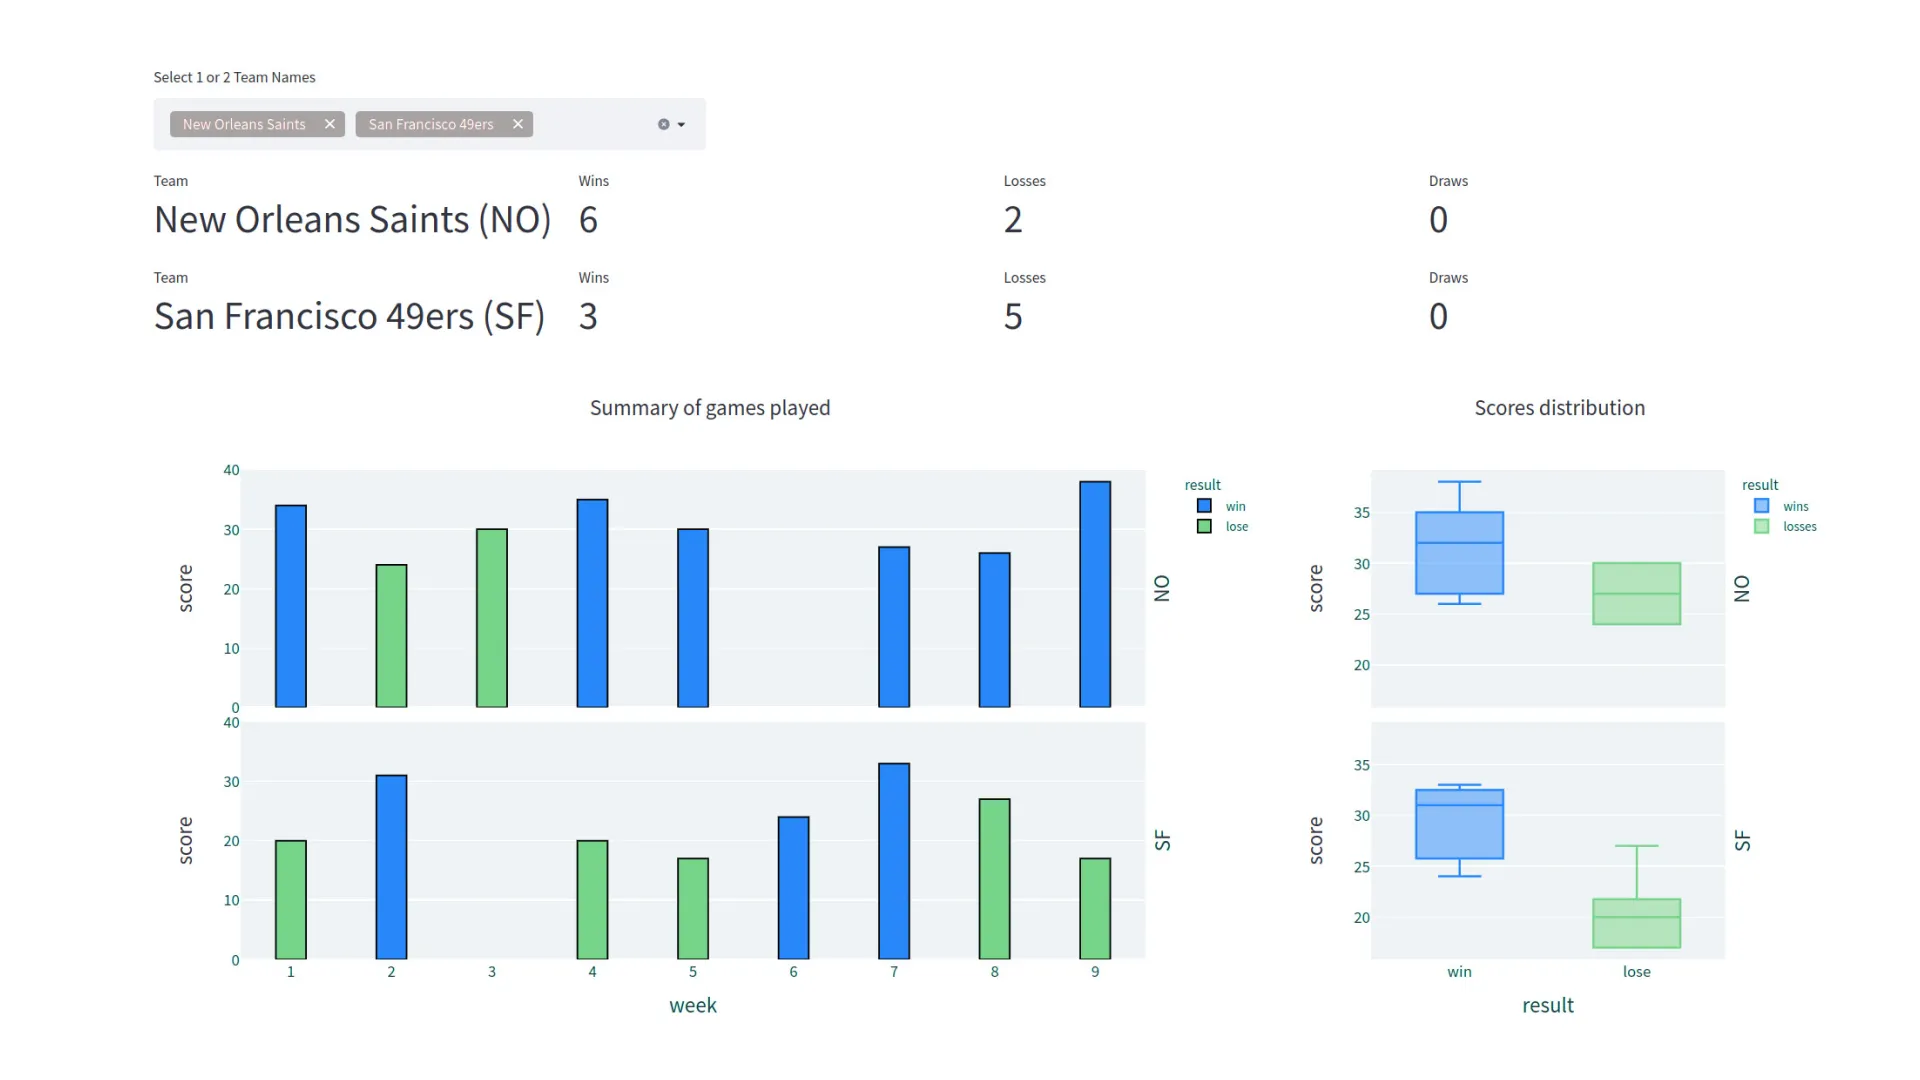
The results of all streamed games were stored. The application enabled one to see how a chosen team fared in the season regarding scores and results and compare it with another team. To this end, plots and numerical information were displayed.
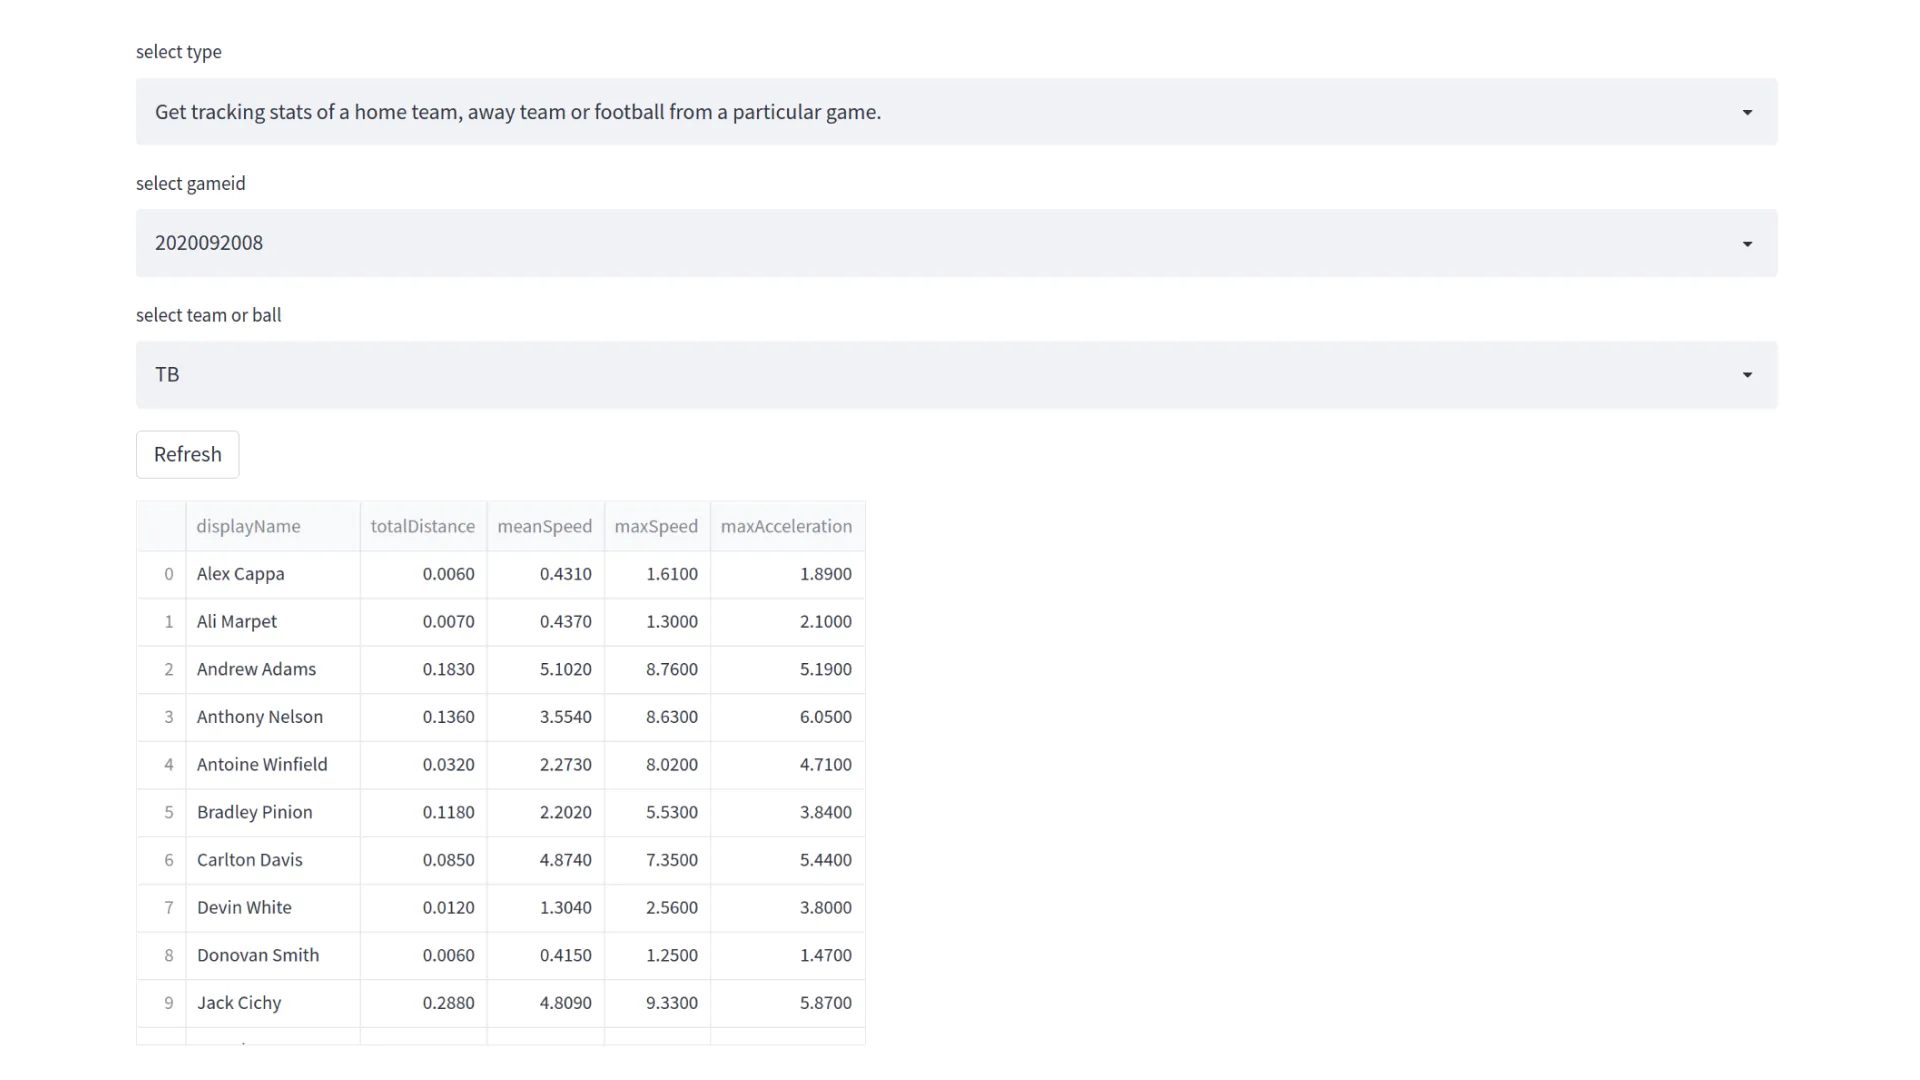
For every game, a set of simple statistics was calculated and updated with every finished play. These involve total distance covered by every player, yards gained by both teams, number of successful kicks and more.
After two months, we finished working on the project, and it was time to reflect on what we managed to accomplish.
We built a fully functional app, and more importantly, working on it was a great opportunity to enhance the expertise of our team. And what a fun way to do it, too! One of the most rewarding aspects of Data Science is learning about all the things you analyze or predict. After a few weeks with American football and the NFL, we cannot wait for the next Super Bowl! We also added new positions to our stack – like Polars or DVC.
The process of building the app was also great in terms of team bonding. It was one of the first opportunities for some team members to work together. Junior developers got to know how we operate at 4soft as well as gained much-needed practical experience.
As for the app, it constitutes a solid basis on which other functionalities might be built. For example, various teams’ and players’ statistics by season may be calculated and displayed. Another example, machine learning methods might be used to predict not only the winners of games but also the results of particular plays (e.g., how many yards an attacking team gains). We will be happy to explore these and other possibilities in the future.
Now, it is time to start new challenges!
